
No credit card required
Academy
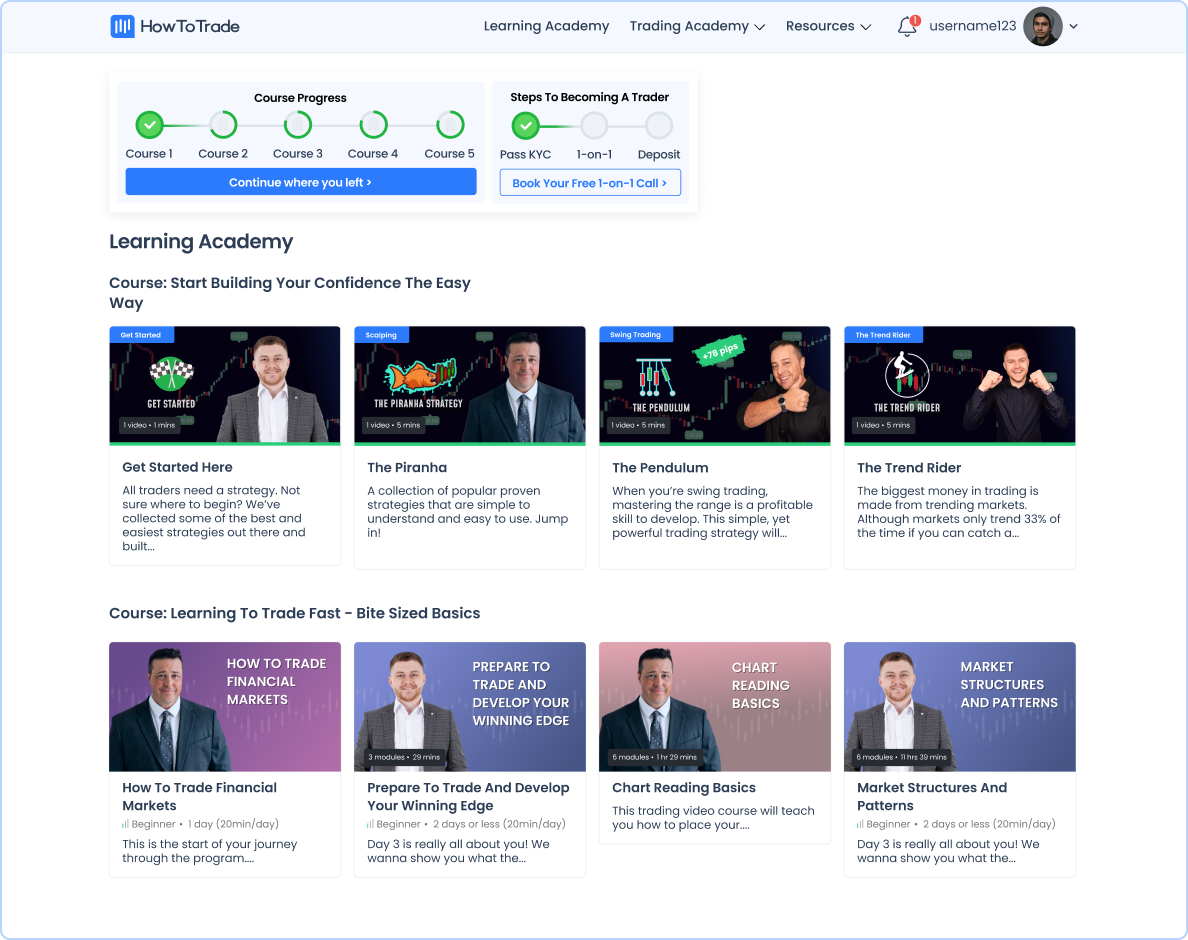
Never Be Overwhelmed By Trading Education Again
Forex trading signals are not enough! Knowledge is everything, the more you know, the better your trading performance will be. Our free Trading Academy is packed with world-class trading education created by professional traders with decades of experience.
- 300+ hours of easy-to-understand video lessons
- Suitable for new and advanced traders
- Test your trading knowledge on a demo account
No credit card required
Enter Our Trading Contest And Win A Share Of $10,000 USD In Real Cash Prizes
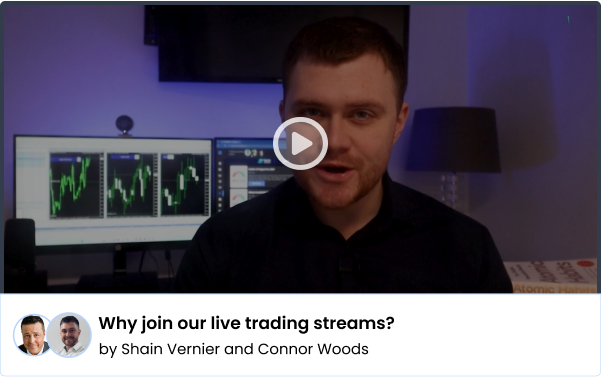
Streams
Live Trading Streams
Join our experts for real-time market analysis, detailed trade breakdowns, and expert guidance. From beginners to seasoned traders, our stream provides the knowledge you need to make informed decisions and improve your trading skills.

It's Time To Trade 2025!
by Shain Vernier

Past Live Streams
View all
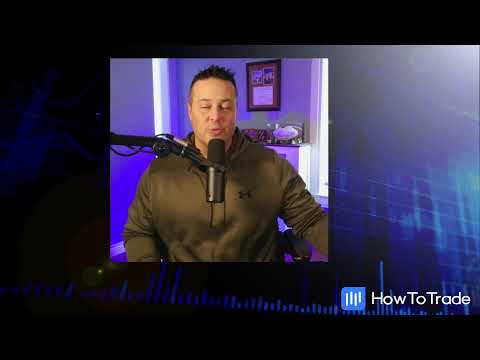
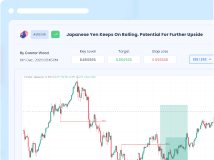
Trading The BoJ & BoE Interest Rate Decisions
By Shain Vernier 19/Dec/2024

Live FOMC Coverage: Jerome Powell Press Conference
By Shain Vernier 18/Dec/2024

10-Minute Strategy Blitz: 9/20 EMA Crossover FED Day Scalping!
By Shain Vernier 18/Dec/2024

Trading A HOT Tuesday Session!
By Shain Vernier 17/Dec/2024
Analysis
Market Analysis
View all
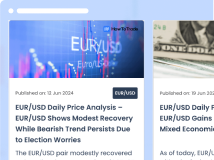
USD/JPY Daily Price Analysis – All Eyes on BoJ’s Next Move
The yen remains under pressure amid speculation...ing opening at 152.626 and climbing […]
Published on: 13 Dec 2024

DAX 40 Daily Forecast – Rheinmetall and Adidas Lead Gains, But DAX Faces Bearish Signals
The DAX 40 edged slightly lower at 20,407.59 (-...er opening at the same level today. […]
Published on: 12 Dec 2024

China’s Gold Buying Spree and CPI Anticipation Drive Bullish Momentum
Market anticipation of U.S. CPI data is driving...$2,725.60 per troy ounce, with spot […]
Published on: 11 Dec 2024
Want to stay up to date whenever we post a market analysis? Sign up for our newsletter:
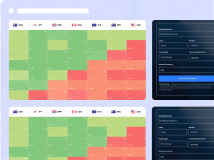
Economic Calendar
Local time
Local time is shown based on your computer's time-zone. For example, if you are in the GMT timezone, Local time will also be shown in GMT.
|
Time left | Country
|
Event | Actual | Est. | Previous | Unit | Impact
|
|
---|---|---|---|---|---|---|---|---|---|
May 30 0:25 | ![]() | Fed's Logan speech | - | - | - | - | |||
May 30 1:30 | ![]() | Retail Sales s.a. (MoM) | -0.1 | 0.3 | 0.3 | % | |||
May 30 1:30 | ![]() | Building Permits (MoM) | -5.7 | 3.1 | -8.8 | % | |||
May 30 1:30 | ![]() | Private Sector Credit (MoM) | 0.7 | 0.5 | 0.5 | % | |||
May 30 1:30 | ![]() | Building Permits (YoY) | 7.6 | - | 13.4 | % | |||
May 30 1:30 | ![]() | Private Sector Credit (YoY) | 6.7 | - | 6.5 | % | |||
May 30 5:00 | ![]() | Gross Domestic Product (QoQ) | - | 0.1 | -0.2 | % | |||
May 30 5:00 | ![]() | Gross Domestic Product (YoY) | 0.9 | - | 1.2 | % | |||
May 30 5:00 | ![]() | Housing Starts (YoY) | -26.6 | -18.3 | 39.1 | % | |||
May 30 5:00 | ![]() | Gross Domestic Product Qtr Prelim (YoY) | 0.8 | - | 2.4 | % | |||
May 30 5:00 | ![]() | Annualized Housing Starts | - | - | 1.08 | - | |||
May 30 5:00 | ![]() | Construction Orders (YoY) | 52.7 | - | 3.5 | % | |||
May 30 6:00 | ![]() | Registered Unemployment s.a | 63.38 | - | 78.06 | - | |||
May 30 6:00 | ![]() | Registered Unemployment n.s.a | 2 | 1.9 | 2 | % | |||
May 30 6:00 | ![]() | Gross Domestic Product (QoQ) | -0.2 | - | 0.2 | % | |||
May 30 6:00 | ![]() | Retail Sales (MoM) | -1.1 | 0.2 | -0.2 | % | |||
May 30 6:00 | ![]() | Gross Domestic Product (YoY) | 0.9 | 1.1 | 1.1 | % | |||
May 30 6:00 | ![]() | M3 Money Supply (YoY) | 6.12 | - | 5.75 | % | |||
May 30 6:00 | ![]() | Retail Sales (YoY) | 2.3 | 1.8 | 2.2 | % | |||
May 30 6:00 | ![]() | Private Sector Credit | 4.6 | - | 3.45 | % | |||
May 30 6:30 | ![]() | Producer Price Index (YoY) | 7.9 | - | 7.3 | % | |||
May 30 7:00 | ![]() | Quarterly Gross Domestic Product | 2 | 2.3 | 3 | % | |||
May 30 7:00 | ![]() | Producer Price Index (YoY) | -0.2 | - | 0.8 | % | |||
May 30 7:00 | ![]() | Consumer Price Index (YoY) | 1.9 | 2.1 | 2.2 | % | |||
May 30 7:00 | ![]() | Harmonized Index of Consumer Prices (MoM) | -0.1 | - | 0.6 | % | |||
May 30 7:00 | ![]() | Gross Domestic Product (YoY) | 2.2 | 2 | 2 | % | |||
May 30 7:00 | ![]() | Consumer Price Index (MoM) | - | 0.1 | 0.6 | % | |||
May 30 7:00 | ![]() | Trade Balance | -1.4 | - | 3.4 | $ | |||
May 30 7:00 | ![]() | KOF Leading Indicator | 98.5 | 98.4 | 97.1 | - | |||
May 30 7:00 | ![]() | Producer Price Index (MoM) | -0.9 | - | - | % | |||
May 30 7:00 | ![]() | Private Investment Index | 2.9 | - | -1 | % | |||
May 30 7:00 | ![]() | Harmonized Index of Consumer Prices (YoY) | 1.9 | 2 | 2.2 | % | |||
May 30 7:00 | ![]() | Unemployment Rate | 8.6 | - | 7.9 | % | |||
May 30 7:00 | ![]() | Private Consumption Index | -1.5 | - | -0.5 | % | |||
May 30 7:00 | ![]() | Current Account | -1.5 | - | 2.3 | $ | |||
May 30 8:00 | ![]() | M3 Money Supply (YoY) | 3.9 | 3.7 | 3.6 | % | |||
May 30 8:00 | ![]() | Current Account Balance | 1.42 | - | 2.31 | € | |||
May 30 8:00 | ![]() | Hesse CPI (YoY) | 2.3 | - | 2.3 | % | |||
May 30 8:00 | ![]() | Gross Domestic Product (YoY) | 0.7 | 0.6 | 0.6 | % | |||
May 30 8:00 | ![]() | Gross Domestic Product (QoQ) | 0.3 | 0.3 | 0.3 | % | |||
May 30 8:00 | ![]() | Saxony CPI (MoM) | - | - | 0.5 | % | |||
May 30 8:00 | ![]() | North Rhine-Westphalia CPI (MoM) | 0.2 | - | 0.4 | % | |||
May 30 8:00 | ![]() | Saxony CPI (YoY) | 2.3 | - | 2.4 | % | |||
May 30 8:00 | ![]() | Hesse CPI (MoM) | - | - | 0.5 | % | |||
May 30 8:00 | ![]() | M3 Money Supply (3m) | 3.8 | - | 3.7 | % | |||
May 30 8:00 | ![]() | Brandenburg CPI (YoY) | 2.2 | - | 2.2 | % | |||
May 30 8:00 | ![]() | Private Loans (YoY) | 1.9 | 1.8 | 1.7 | % | |||
May 30 8:00 | ![]() | Baden-Wuerttemberg CPI (MoM) | -0.1 | - | 0.5 | % | |||
May 30 8:00 | ![]() | North Rhine-Westphalia CPI (YoY) | 2 | - | 1.8 | % | |||
May 30 8:00 | ![]() | Brandenburg CPI (MoM) | - | - | 0.4 | % | |||
May 30 8:00 | ![]() | Bavaria CPI (MoM) | 0.1 | - | 0.4 | % | |||
May 30 8:00 | ![]() | Bavaria CPI (YoY) | 2.1 | - | 2.1 | % | |||
May 30 8:00 | ![]() | Baden-Wuerttemberg CPI (YoY) | 2.2 | - | 2.4 | % | |||
May 30 8:30 | ![]() | ECB's Panetta speech | - | - | - | - | |||
May 30 9:00 | ![]() | Gross Domestic Product (QoQ) | 2.7 | - | -1.4 | % | |||
May 30 9:00 | ![]() | Gross Domestic Product (YoY) | 2.6 | - | 2.3 | % | |||
May 30 9:00 | ![]() | Consumer Price Index (YoY) | 1.7 | 1.7 | 1.9 | % | |||
May 30 9:00 | ![]() | Producer Price Index (YoY) | 0.5 | - | 2.1 | % | |||
May 30 9:00 | ![]() | Retail Sales (YoY) | 0.3 | - | 4.6 | % | |||
May 30 9:00 | ![]() | Consumer Price Index (MoM) | - | 0.1 | 0.1 | % | |||
May 30 9:00 | ![]() | Consumer Price Index (EU Norm) (MoM) | 0.1 | - | 0.4 | % | |||
May 30 9:00 | ![]() | Consumer Price Index (EU Norm) (YoY) | 1.9 | 1.9 | 2 | % | |||
May 30 9:00 | ![]() | Unemployment Rate (MoM) | 8.3 | - | 9 | % | |||
May 30 10:00 | ![]() | Gross Domestic Product (QoQ) | -0.5 | -0.5 | -0.5 | % | |||
May 30 10:00 | ![]() | Consumer Price Index (MoM) | 0.4 | - | 0.7 | % | |||
May 30 10:00 | ![]() | Gross Domestic Product (YoY) | 1.6 | 1.6 | 1.6 | % | |||
May 30 10:00 | ![]() | Consumer Price Index (YoY) | 2.3 | - | 2.1 | % | |||
May 30 10:20 | ![]() | Producer Price Index (YoY) | 2.6 | - | 3.9 | % | |||
May 30 10:20 | ![]() | Producer Price Index (MoM) | -2.2 | - | -2.4 | % | |||
May 30 10:30 | ![]() | Gross Domestic Product Quarterly (YoY) | 7.4 | 6.7 | 6.2 | % | |||
May 30 11:30 | ![]() | FX Reserves, USD | 692.72 | - | - | $ | |||
May 30 11:30 | ![]() | Bank Loan Growth | 9.8 | - | 9.9 | % | |||
May 30 11:30 | ![]() | Nominal Budget Balance | -55.536 | -58.1 | -71.621 | - | |||
May 30 11:30 | ![]() | Primary Budget Surplus | 14.15 | - | 3.588 | - | |||
May 30 12:00 | ![]() | Jobless Rate | 2.5 | 2.5 | 2.2 | % | |||
May 30 12:00 | ![]() | Jobless Rate s.a | 2.6 | - | 2.6 | % | |||
May 30 12:00 | ![]() | Consumer Price Index (YoY) | 2.1 | 2.1 | 2.1 | % | |||
May 30 12:00 | ![]() | Harmonized Index of Consumer Prices (YoY) | 2.1 | 2 | 2.2 | % | |||
May 30 12:00 | ![]() | Consumer Price Index (MoM) | 0.1 | 0.1 | 0.4 | % | |||
May 30 12:00 | ![]() | Gross Domestic Product (YoY) | 2.9 | 3.2 | 3.6 | % | |||
May 30 12:00 | ![]() | Gross Domestic Product (QoQ) | 1.4 | 1.4 | 0.2 | % | |||
May 30 12:00 | ![]() | Harmonized Index of Consumer Prices (MoM) | 0.2 | 0.1 | 0.5 | % | |||
May 30 12:00 | ![]() | Trade Balance (in Rands) | 14.08 | - | 24.77 | - | |||
May 30 12:00 | ![]() | Federal Fiscal Deficit, INR | 15.7727K | - | 13.4685K | - | |||
May 30 12:30 | ![]() | Goods Trade Balance | -87.62 | -141.5 | -163.5 | $ | |||
May 30 12:30 | ![]() | Gross Domestic Product (QoQ) | 0.5 | - | 0.6 | % | |||
May 30 12:30 | ![]() | Gross Domestic Product Annualized | 2.2 | 1.7 | 2.6 | % | |||
May 30 12:30 | ![]() | Wholesale Inventories | - | 0.4 | 0.4 | % | |||
May 30 12:30 | ![]() | Personal Consumption Expenditures - Price Index (YoY) | 2.1 | 2.2 | 2.3 | % | |||
May 30 12:30 | ![]() | Core Personal Consumption Expenditures - Price Index (MoM) | 0.1 | 0.1 | - | % | |||
May 30 12:30 | ![]() | Personal Spending | 0.2 | 0.2 | 0.7 | % | |||
May 30 12:30 | ![]() | Personal Income (MoM) | 0.8 | 0.3 | 0.5 | % | |||
May 30 12:30 | ![]() | Gross Domestic Product (MoM) | 0.1 | 0.1 | -0.2 | % | |||
May 30 12:30 | ![]() | Personal Consumption Expenditures - Price Index (MoM) | 0.1 | 0.1 | - | % | |||
May 30 12:30 | ![]() | Core Personal Consumption Expenditures - Price Index (YoY) | 2.5 | 2.5 | 2.6 | % | |||
May 30 13:00 | ![]() | Industrial Production (YoY) | 3.8 | - | 4.5 | % | |||
May 30 13:45 | ![]() | Chicago PMI | 40.5 | 45 | 44.6 | - | |||
May 30 14:00 | ![]() | Michigan Consumer Sentiment Index | 52.2 | 51 | 50.8 | - | |||
May 30 14:00 | ![]() | UoM 5-year Consumer Inflation Expectation | 4.2 | 4.6 | 4.6 | % | |||
May 30 14:00 | ![]() | Michigan Consumer Expectations Index | 47.9 | 46.5 | 46.5 | - | |||
May 30 14:00 | ![]() | UoM 1-year Consumer Inflation Expectations | 6.6 | 7.3 | 7.3 | % | |||
May 30 15:00 | ![]() | National Jobless Rate | 8.8 | - | 9.6 | % | |||
May 30 16:00 | ![]() | Dragon Boat Festival | - | - | - | - | |||
May 30 16:00 | ![]() | Pesta Kaamatan | - | - | - | - | |||
May 30 16:00 | ![]() | Tuen Ng Festival | - | - | - | - | |||
May 30 16:00 | ![]() | Dragon Boat Festival | - | - | - | - | |||
May 30 16:20 | ![]() | Fed's Bostic speech | - | - | - | - | |||
May 30 17:00 | ![]() | Baker Hughes US Oil Rig Count | 461 | - | - | - | |||
May 30 19:30 | 9min | ![]() | CFTC EUR NC Net Positions | - | - | - | € | ||
May 30 19:30 | 9min | ![]() | CFTC JPY NC Net Positions | - | - | - | ¥ | ||
May 30 19:30 | 9min | ![]() | CFTC GBP NC Net Positions | - | - | - | £ | ||
May 30 19:30 | 9min | ![]() | CFTC Oil NC Net Positions | - | - | - | - | ||
May 30 19:30 | 9min | ![]() | CFTC AUD NC Net Positions | - | - | - | $ | ||
May 30 19:30 | 9min | ![]() | CFTC Gold NC Net Positions | - | - | - | $ | ||
May 30 19:30 | 9min | ![]() | CFTC S&P 500 NC Net Positions | - | - | - | $ | ||
May 30 20:45 | 1h 24min | ![]() | Fed's Daly speech | - | - | - | - | ||
May 30 21:00 | 1h 39min | ![]() | Fiscal Balance, pesos | - | - | -24.6 | - |

Trading Statistics
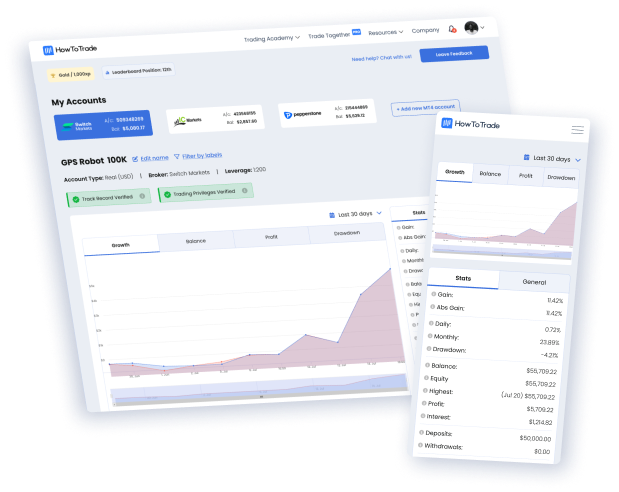
Link Your Trading Account And Improve Your Trading Today
Dissect the good, the bad, and the ugly with our powerful trading analytics alongside trading analysts.
- Intelligent Insights: Dive into your trading data to uncover patterns, trends, and opportunities for improvement.
- Learn from Mistakes: Understand past performance to avoid repeating mistakes
- Expert Guidance at Your Fingertips: Connect with experienced trading analysts, ask questions, and get personalized feedback to enhance your skills.
Tools
Everyday Trading Tools
View all Trading Tools
Forex Swap Calculator
Calculate your profits and losses before or after executing a trade.
Lot Size Calculator
Calculate the exact position size for each trade and manage your risk per trade.
Currency Strength Meter
A interactive currency strength meter to show you which currency pairs are strong and weak, in real-time.
Forex Heatmap
Real-time data that can help you determine the strongest and the weakest currencies on the Forex market.
Monte Carlo Simulation
Estimate the possible outcomes of your trades and estimate your trading strategies' viability.
Value At Risk Calculator
Help you make more informed investment decisions and help protect your money.
Swap Calculator
Calculate the swap fee you will be charged for holding your positions overnight.
Economic Calendar
View relevant events to help you trade these markets.